Supplier Scorecard Template for Manufacturers
Most supplier scorecards produce one weighted number that nobody can act on. The fix is to make every band trigger a named action. Four metrics, six fields, and the columns to leave off.

Introduction
Almost every supplier scorecard you will see ends in a single number. Quality is 40 percent, delivery 30, responsiveness 15, cost 15, multiply and sum, and the shop comes out at 87.4. The number goes on a slide, the slide goes to a quarterly review, and nothing changes at the supplier.
That is not a weighting problem, and tuning the percentages will not fix it. The problem is that a weighted average is built to rank and the scorecard's actual job is to trigger. A supplier at 87.4 could be running clean quality and missing a third of its dates, or holding every date and shipping one bad lot in five. Those are two completely different conversations and the composite has deliberately destroyed the difference between them.
The useful version is less sophisticated and much harder to argue with. Four metrics, each defined in one sentence, each pulled from a system rather than from an opinion, each banded into green, yellow and red with the numeric cut written down in advance, and each band attached to a named action with an owner. No roll-up. A supplier can be green on quality and red on delivery, and the card says so, because that is the truth and it is also the only form the truth is actionable in.
This article gives you that template, the definitions that have to sit behind each column, and the columns that look reasonable and quietly score your own purchasing department instead of the supplier.
Why You Have to Have One
If you hold ISO 9001:2015, scorekeeping is not optional, though the standard is careful never to use the word scorecard. Clause 8.4.1 requires you to determine and apply criteria for the evaluation, selection, monitoring of performance and re-evaluation of external providers, based on their ability to provide processes or products and services in accordance with requirements, and to retain documented information of those activities and any actions arising from them.
Read that list again, because it contains four separate obligations and most supplier programs only discharge two. Evaluation and selection happen at onboarding, and everybody does those. Monitoring of performance is continuous. Re-evaluation is periodic and based on what the monitoring found. A supplier approved in 2021 against a questionnaire, never measured since, is a nonconformance waiting for an auditor who reads the whole clause.
Clause 9.1.3 closes the loop from the other end: the performance of external providers is one of the things the results of analysis and evaluation have to be used to evaluate. The scorecard is simply the artefact that makes both clauses demonstrable in one page per supplier.
The Four Metrics
If you want a defensible short list, take the automotive one. IATF 16949:2016 clause 8.4.2.4 requires a documented process and criteria to evaluate supplier performance, and then names the minimum indicators that process has to monitor: delivered product conformity to requirements, customer disruptions at the receiving plant including yard holds and stop ships, delivery schedule performance, and the number of occurrences of premium freight. Where the customer provides them, it adds special status customer notifications related to quality or delivery issues, and dealer returns, warranty, field actions and recalls.
You are probably not an automotive tier one, and you should still steal that list, because it is the only widely published minimum set and the reasoning behind each entry survives outside the industry.
Delivered product conformity is the obvious one. Did the parts meet the drawing.
Disruption at the receiving plant is the one nobody else measures and the one that predicts trouble best. A supplier can be inside tolerance on quality and on time on delivery and still stop your line, because the paperwork was wrong, the lot was mixed, the packaging failed, or the certificate did not arrive with the truck. Counting the times a shipment caused work at your end that it should not have is a different signal from counting defects.
Delivery schedule performance needs a definition before it needs a target, which is the next section.
Premium freight occurrences is the cheapest leading indicator in the whole set. Expedited freight is what a shop buys when it has already lost the schedule and has not told you yet. A supplier whose premium freight count climbs for two months is usually a supplier whose on-time number is about to fall, and you have a month of warning for free, because the data is sitting in freight invoices you already pay.
Four columns. You can add a fifth, and you will be tempted, and the discipline is to make the fifth one earn its place against those four rather than alongside them.
On-Time Delivery Is a Definition, Not a Measurement
More scorecard arguments come from this one row than from everything else combined, because buyer and supplier are usually measuring two different things and both believe they are measuring on-time delivery.
Four questions have to be answered in writing before the first number is calculated.
Against which date? The original date the supplier acknowledged on the purchase order, or the latest revised date in your system. These diverge enormously. Measuring against the revised date rewards a supplier who negotiates well and makes your own expediting invisible. Measuring against the original acknowledged date is harsher and is the only version that tells you whether the schedule you planned around was real. Pick the acknowledged date and say so.
Received or shipped? Dock date at your receiving door, or ship date at theirs. On an FOB origin term the carrier's transit is yours, so holding a supplier to a dock date is holding them to something they do not control. Use ship date for FOB origin and dock date for FOB destination, and record which term applies.
How wide is the window? On time rarely means to the day. A two-day early to zero-day late window is common and defensible. What is not defensible is leaving it unstated, because the supplier will assume one and you will assume another. Note that early is not automatically fine either, since early shipments move inventory cost onto you.
In full or in part? A line shipped at 60 percent on the date is not on time in any sense your production planner recognises. Measure on time and in full together, scored as one, with a partial counting as a miss on the original date and the balance counting again on its own date.
The ASCM SCOR framework takes this all the way and calls the result perfect order fulfillment: an order line counts only if it arrived on time, complete, in the right condition, and with accurate and complete documentation, and any one of those failing scores the whole line zero. That is stricter than most supplier bases can stand on day one. It is the right direction of travel, and it explains why a scorecard built on four separate pass-or-fail conditions tells you more than one built on four percentages that each average their own failures away.
Quality, and What PPM Hides
Parts per million defective is the standard quality column and it is a ratio, which means it can be moved by either half of the fraction.
A supplier shipping 40 rejects out of 200,000 parts is at 200 PPM. The same supplier shipping 40 rejects out of 20,000 parts is at 2,000 PPM. If your volumes doubled this year, every supplier's PPM improved and none of them did anything. If you buy a mix of a 50,000-piece stamping and a 12-piece machined weldment from the same shop, one PPM figure covering both is arithmetic rather than information.
Three practical rules.
Band by part family, not by vendor. Compute the number separately for high-volume and low-volume work, or at least note which dominates the denominator.
Count lots as well as pieces. Lot acceptance rate, meaning the share of received lots accepted without any disposition, is the metric your receiving inspector actually experiences and it does not move when volumes move. On low-volume work it is the better number of the two, and on a twelve-piece order PPM is close to meaningless.
Separate escapes from findings. A defect you caught at incoming inspection and a defect your customer caught are not the same event and should never be summed. One costs you an hour of sorting. The other costs you a corrective action, a customer notification and possibly the account.
Add response time to a corrective action as a quality subcolumn if you like, measured from the day you issued the request to the day you accepted the containment, not to the day the supplier replied. Replying is not closing.
The Columns That Score You Instead
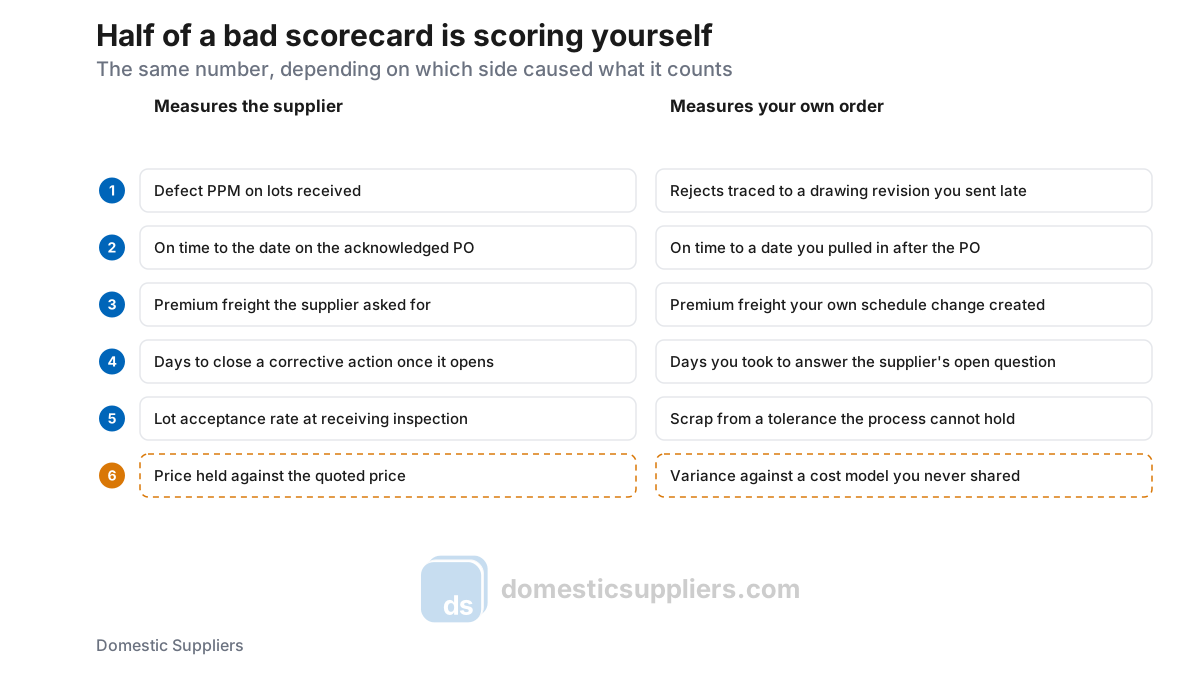
Every metric on the left of that figure is a legitimate thing to measure. Every one on the right is the same metric picking up a cause the supplier had no hand in, and once a scorecard carries enough of the right-hand version it stops being a management tool and becomes a document the supplier disputes.
The fix is unglamorous: attribute before you count. When a reject traces to a revision you released after the parts were cut, it comes off the supplier's PPM and goes into your own engineering change log, where it belongs and where it is at least as useful. When an expedite exists because your release moved in, the premium freight occurrence is yours. This takes a few minutes per event and it buys you the one thing a scorecard cannot function without, which is a supplier who believes the numbers.
Two more columns deserve a specific warning.
Responsiveness, rated one to five. It is the most common fifth column and it is a judgment dressed as data. If responsiveness matters, measure something countable: hours to acknowledge an RFQ, days to return a quote, days to close a corrective action. Then it is a metric. A five-point scale assigned by whoever last spoke to the supplier is a record of that relationship, not of the shop.
Cost, as a percentage weight. Price belongs in the sourcing decision, with a landed-cost model behind it, and it does not belong in the same weighted sum as defect rate. Putting cost on the scorecard at 15 percent means a supplier can buy its way out of a quality band with a price concession, which is exactly the trade Deming's fourth point told you to stop making: end the practice of awarding business on price tag alone, and minimize total cost instead. Keep the scorecard about performance and keep price in the quote.
The Template
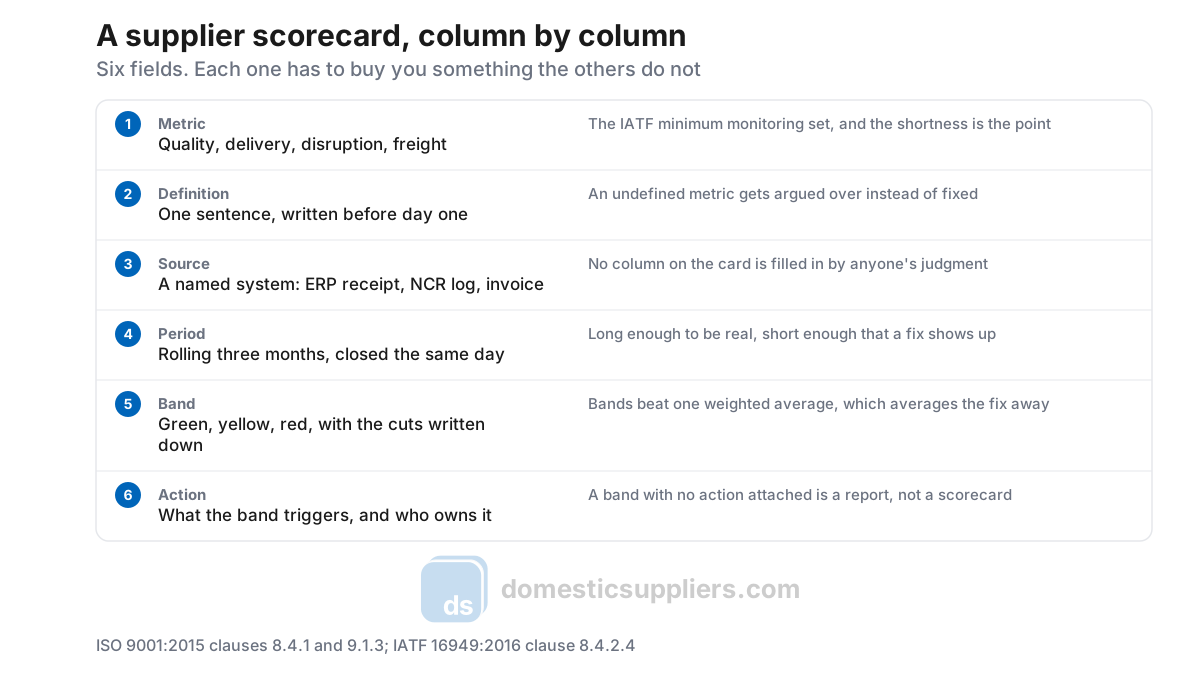
The card is one page per supplier per quarter and it has six columns, not four metrics and a total.
Metric. One of the four. Named the same way every quarter so a trend means something.
Definition. The sentence from the sections above, printed on the card itself. Not in a procedure nobody opens. On the card, so that the first time a supplier queries a number you are reading the same sentence they are.
Source. The system the figure came from, by name and field. Receipts from the ERP for delivery. The nonconformance log for quality. Freight invoices for premium freight. The receiving disruption log for disruptions. If a column has no system behind it, either build the system or delete the column.
Period. A rolling three months, closed on the same calendar day each month. Rolling, because a quarter that resets on January 1 lets a December problem vanish. Three months, because one month on low-volume work is noise and twelve months is too slow to respond to.
Band. Green, yellow and red, with the numeric cut written before you measure anything. Setting bands after you see the data is how everybody ends up green.
Action. The column that makes the rest of it worth printing. Green means nothing happens, which should be said out loud, because a scorecard that generates work for good suppliers trains them to manage the scorecard. Yellow means a written response with a containment and a root cause, due on a date. Red means an escalation with a named owner on both sides, and on a repeat red it means a second-party audit or a sourcing decision.
That last step is where the automotive standard points too. IATF 16949 clause 8.4.2.4.1 expects second-party audits to be used for supplier risk assessment, supplier monitoring, QMS development and product audits, and clause 8.4.2.3 asks you to define a minimum acceptable level of quality management system development for each supplier along with a target level, with ISO 9001 certification as the initial minimum unless the customer authorises otherwise. In plain terms: the scorecard tells you which supplier needs development, and the development plan is the thing a red band is supposed to produce.
Running It Without It Dying
Scorecard programs die in predictable ways.
Too many suppliers. Score the suppliers whose failure would stop you. For most shops that is between ten and forty of several hundred vendors. Sorting the rest by spend and scoring the top of the list is not the same thing, because the cheap single-source casting that nobody else pours outranks a large commodity spend with four alternates.
Nobody sends it. A scorecard the supplier never sees is an internal report. Send it, with the definitions attached, and send it even when it is all green.
It arrives from the wrong person. A card that comes from quality and a card that comes from purchasing get different responses. Send one card, from one owner, covering all four metrics.
The data is wrong once. This is the real killer. Attribute carefully, and when a supplier proves a number wrong, correct it on the card and keep the corrected version. A program that has visibly corrected itself is trusted. One that has never been wrong is not being read.
Nothing follows a red. Two reds with no consequence teaches the supplier base that the bands are decoration, and after that you are back to the slide with 87.4 on it.
Conclusion
The scorecard that works is the one a supplier can read and know exactly what to fix by Friday. That means four metrics rather than nine, a written definition for each, a system of record behind every figure, bands set before you see the data, and an action attached to every band. It also means attributing each event honestly, so the card measures the supplier rather than your own release schedule. ISO 9001 already requires you to monitor and re-evaluate external providers and to retain the records; IATF 16949 already tells you which four indicators to start with. The only decision left to you is whether the output is a ranking nobody uses or a page that produces work at the supplier who needs it.